Analytics
The Analytics page in the sidebar shows how the selected agent is doing, live: four tiles and four charts for New Conversations, Messages, Leads Captured and Angry customers over a window you choose, from the last hour to a custom date range. Plan usage lives on My Subscription, and exports on the Clients, Contacts and Agent Knowledge pages.
What does the Analytics page show?
Pick the agent at the top of the dashboard; the page reads Live performance for the selected agent. Choose a window with 1h, 24h, 7d or 30d, which roll forward as time passes, or Custom for a fixed range of whole days up to today, then Apply. The default is the last 7 days.
| Tile and chart | What it counts |
|---|---|
| New Conversations | Conversations that started in the window |
| Messages | Messages exchanged in the agent's conversations in the window |
| Leads Captured | Tool actions completed, counted once per conversation for each tool: a saved lead, a booking, a sheet row or a Custom API call |
| Angry | Conversations where the customer's messages read as angry; the tile shows the share of conversations, and the chart adds an "angry rate" line for windows of 7 days or more |
Each chart groups the window into bars: by minute for an hour, every 5 minutes for a day, hourly for a week, daily beyond that. An empty window reads No data in this window.
Is the data live?
Yes. Tiles and charts refresh as messages arrive, so a reply shows within seconds, and preset windows keep rolling forward while the page is open. A custom range stays fixed. New Conversations covers your whole history; Messages, Leads Captured and Angry are counted from the day Analytics launched, so earlier activity is missing from those three.
Where do I see my plan usage?
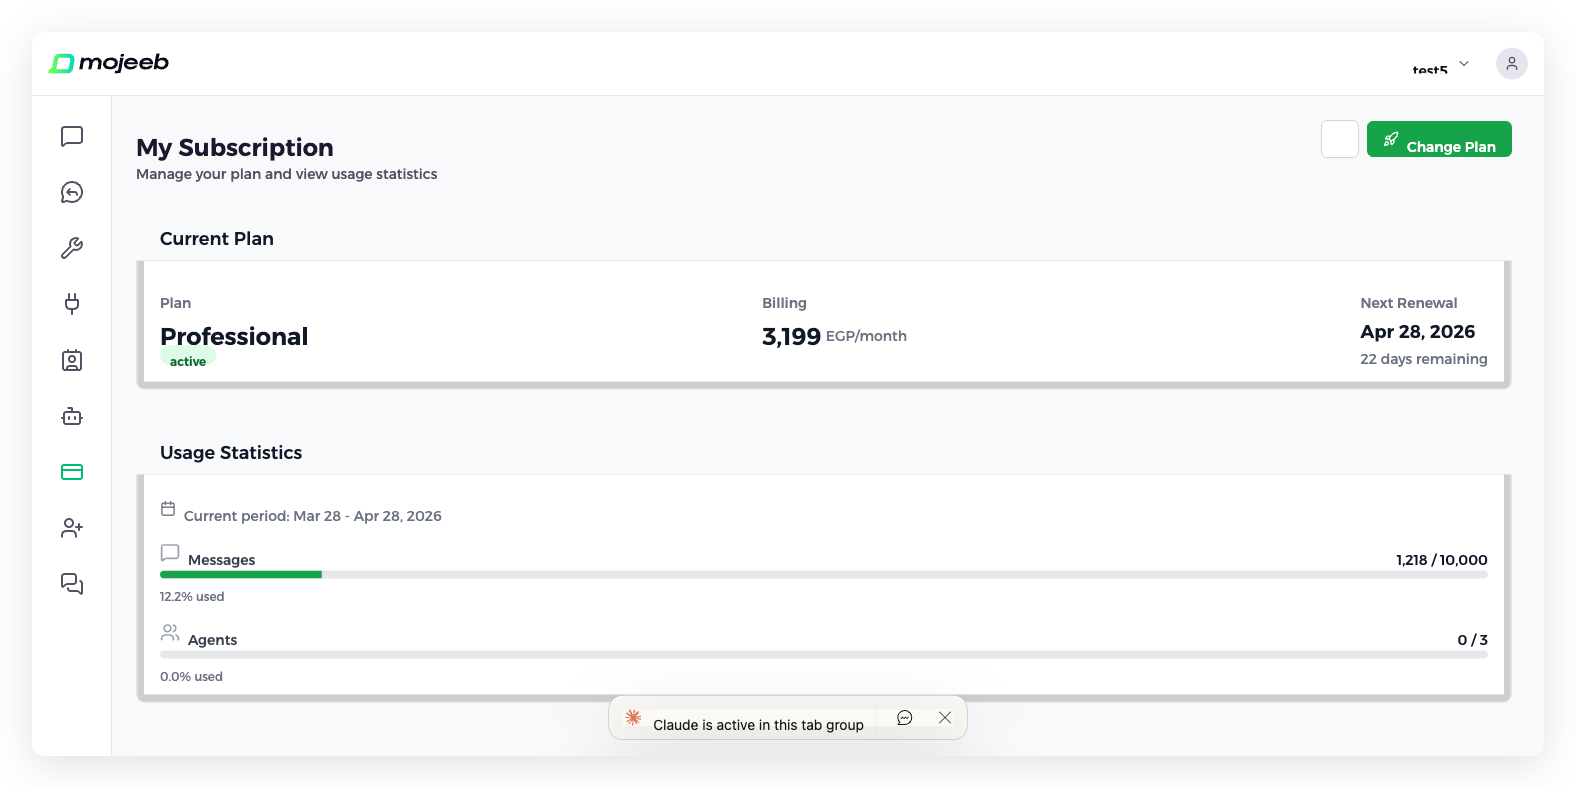
On My Subscription, under Usage Statistics: a Messages bar with used and limit and the percentage used, an Agents bar, the Current period dates, and View History, which opens Usage History with the limits and usage of every billing period. The numbers refresh when you open the page. See Manage Subscription.
Can I export data?
Yes, from three pages, for owners and admins; members see a permission notice.
- Clients — Three-dot menu (⋮) → Extract → Export Leads: Excel (.xlsx), CSV or JSON, then Start Export. The file follows the current search, date range and the first selected status. See Clients.
- Contacts — Three-dot menu (⋮) → Extract → Export Contacts, same formats; follows the current filters. See Contacts.
- Agent Knowledge — Three-dot menu (⋮) → Extract → Choose export format: JSON, PDF or Excel (.xlsx) of the instructions, knowledge and attachments. See Agent Knowledge.
Conversations cannot be exported. On the Professional plan, a broadcast's recipients and their delivery status export from the broadcast page.
Common questions
How far back does data go?
New Conversations goes back to your first conversation; the other three metrics start from the day Analytics launched. Usage history goes back billing period by billing period, and conversations stay on the Chats page for the life of the account.
Are analytics real-time?
The Analytics page is. Usage on My Subscription refreshes when you open the page.
Can I export conversation data?
No. Conversations are read on the Chats page, where Search inside messages finds text in the last 30 days, or in everything with Search all history. Leads, contacts and the agent's knowledge can be exported.
Why do the Chats and Clients pages show no totals?
They are working lists with filters, such as Unread, Needs Attention, Date and All Platforms on Chats, not reports. Totals and trends are on the Analytics page.
Can I get these numbers in my own tools?
Yes. The Public API returns the same numbers for each UTC day, for your reports or BI tools; see Agent Analytics in the developer docs. Your plan usage is there too; see Plan and Usage.